
Are Traditional Monitoring Tools Dead? Why an Observability Platform Is Non-Negotiable for AI Workloads
A service can be online, fast, and returning successful responses while producing poor, unsafe, costly, or unreliable results. AI workloads change the operating question — and what an observability platform has to answer.
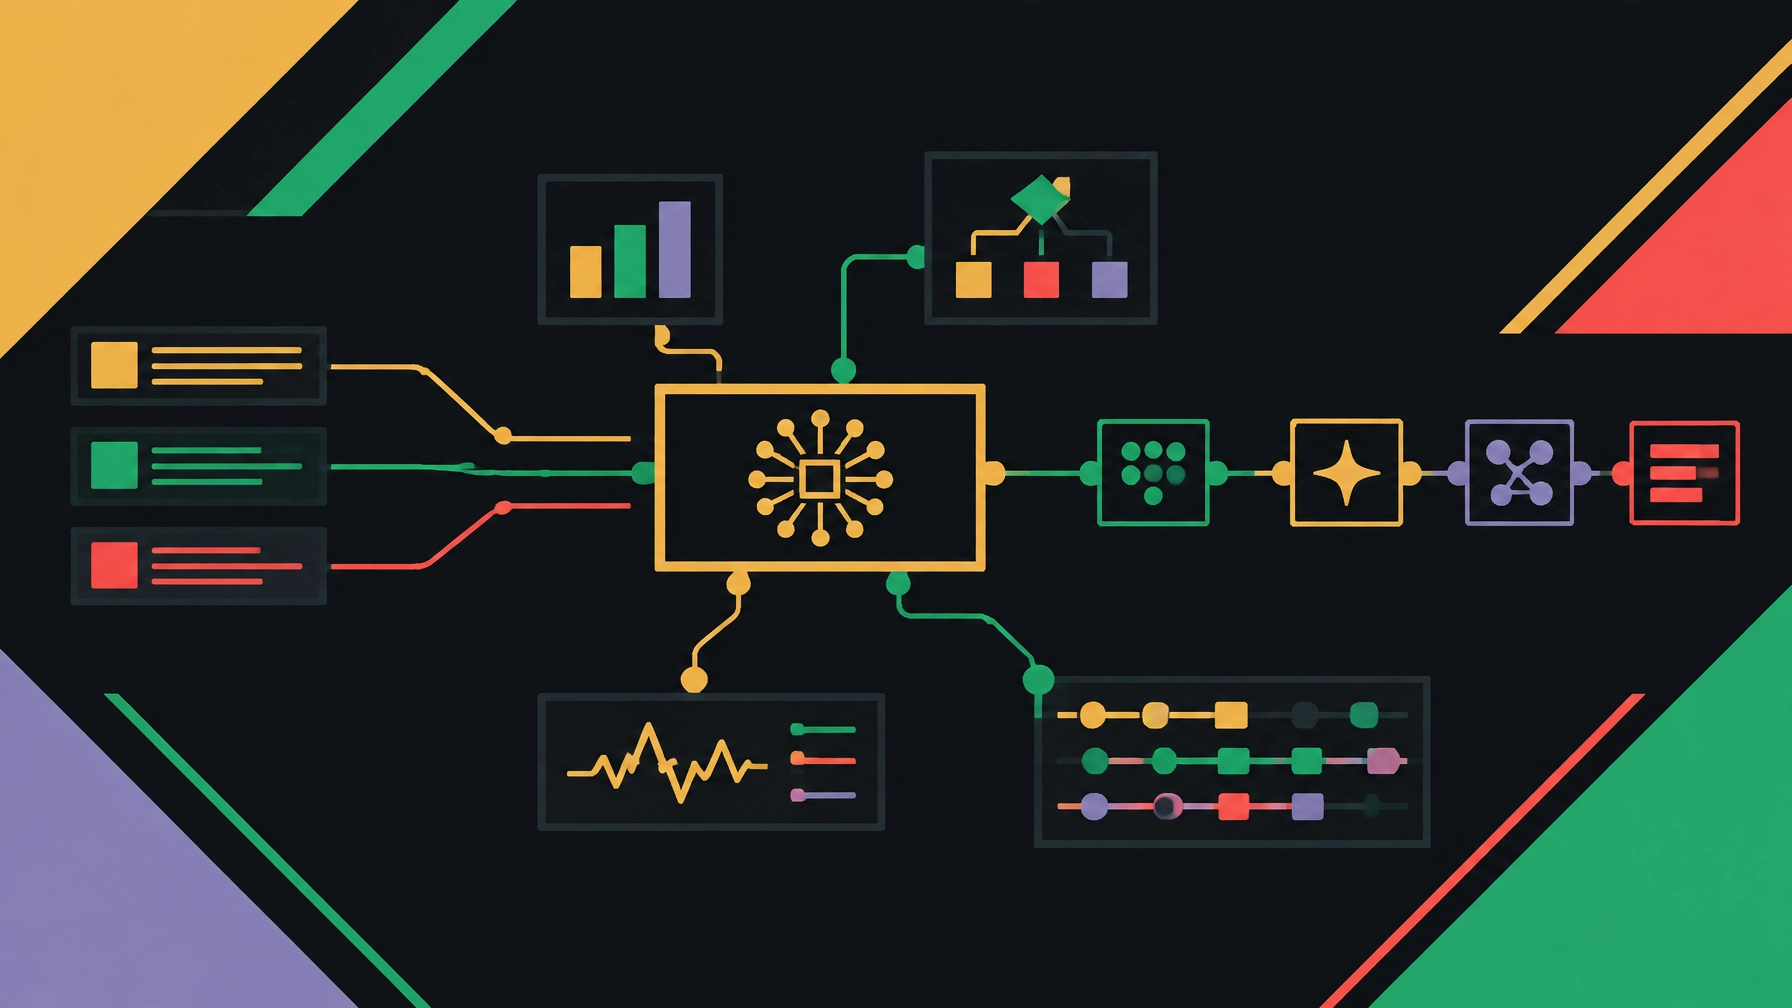
Traditional monitoring tools are not dead.
They remain useful for checking uptime, latency, error rates, resource consumption, and service availability. These signals still matter. Every serious technology operation needs them.
But AI workloads introduce a different class of operational problem. A service can be online, fast, and returning successful responses while producing poor, unsafe, costly, or unreliable results.
That is where an observability platform becomes necessary.
AI systems require more than a system monitoring tool that reports whether a service is available. They require connected context across infrastructure, applications, models, prompts, retrieval systems, tool calls, cost, incidents, and user-facing outcomes.
The question is no longer only, “Is the system running?”
It is also:
- Did the system produce a useful result?
- Why did it behave that way?
- Which step introduced the problem?
- What did the request cost?
- Can the issue be investigated and corrected?
AI changes the operating question.
Monitoring tells you what happened
Traditional monitoring is built around known signals and predefined thresholds.
Teams track metrics such as:
- CPU and memory usage
- Request volume
- Error rates
- Response latency
- Database performance
- Service availability
These signals are essential for infrastructure and application operations. They help teams detect service degradation and respond to familiar failure modes.
Monitoring is especially effective when systems behave in predictable ways. A service returns an error. A database reaches capacity. A container restarts. A response exceeds its latency target.
The signal is clear. The alert is actionable.
Observability goes further. It helps operators investigate why a system behaves as it does, including when the failure was not anticipated in advance. The OpenTelemetry observability primer describes this as the ability to understand a system from the outside and investigate unknown problems through telemetry such as logs, metrics, and traces.
The distinction is practical.
Monitoring identifies the signal. Observability connects the evidence.
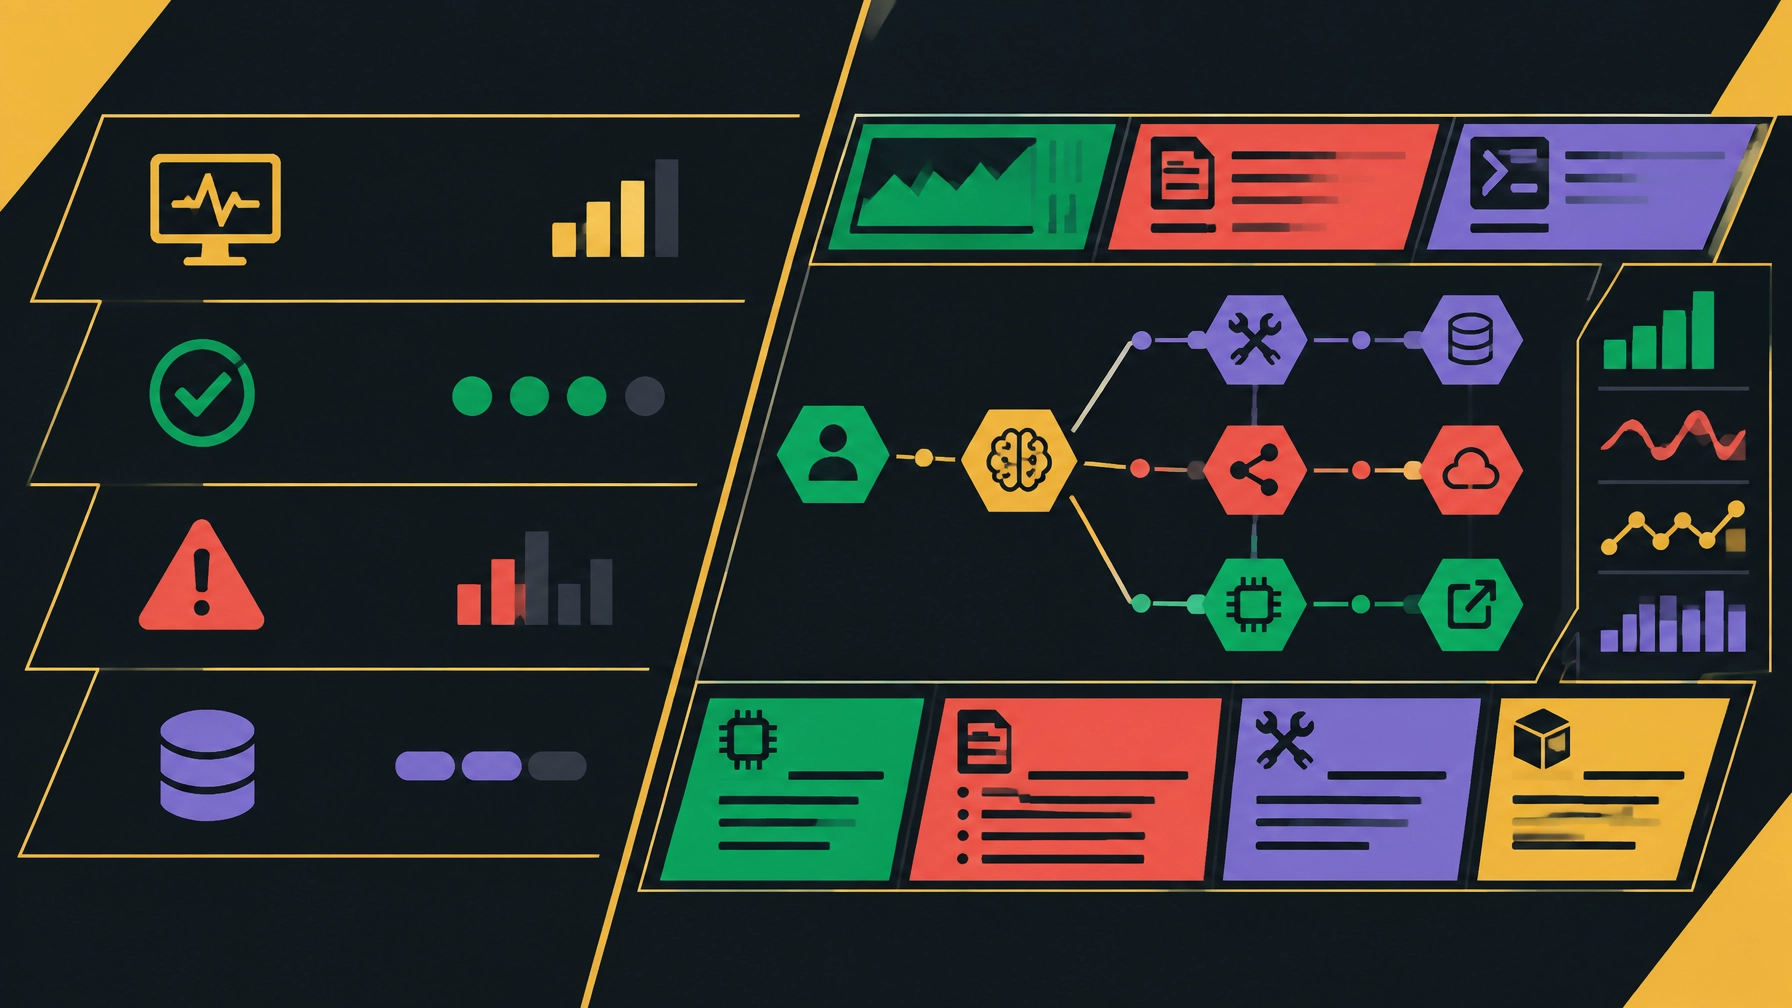
AI systems fail beyond the service layer
AI workloads create failure modes that ordinary application monitoring does not always capture.
An AI request can return a successful HTTP response and still be wrong. It can be technically available but operationally unreliable.
Consider a customer support assistant. The application may report:
- 200 OK responses
- Normal request latency
- Low infrastructure error rates
- Healthy model API connectivity
Yet the assistant may still provide an inaccurate answer, cite the wrong source, expose restricted information, or enter an inefficient tool loop.
The system is available. The experience is not reliable.
AI workloads also contain more moving parts. A single request may pass through an application, a prompt layer, a model provider, a retrieval system, a vector database, several external tools, and a policy or validation service.
A failure in any step can affect the final result.
Without connected traces, operators are left with isolated logs and dashboards. They can see that something went wrong. They cannot easily see the path that produced the outcome.
That creates longer investigations, unclear ownership, and repeated incidents.
Why an AI observability tool needs context
An AI observability tool must show more than model availability. It must connect AI activity to the wider service and infrastructure environment.
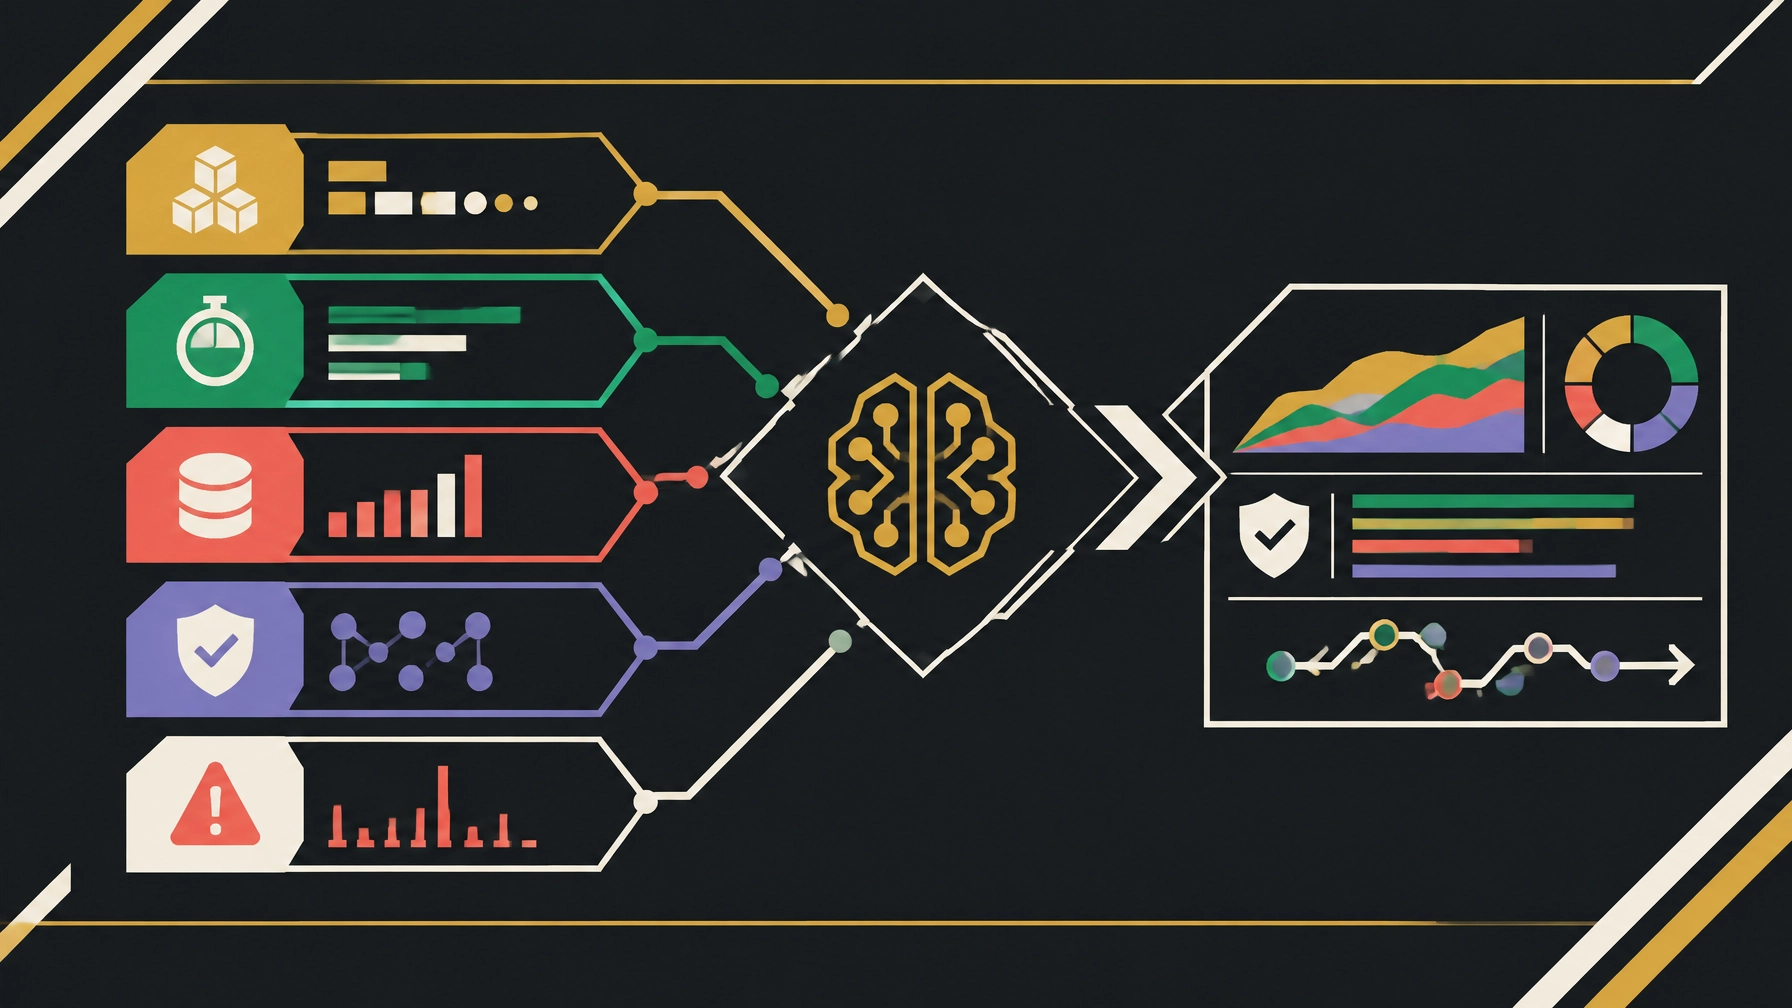
The most useful context typically includes:
Execution path. The full sequence of services, model calls, retrieval operations, and tool executions behind a request.
Performance. Latency at each step, not only the total response time.
Cost. Token usage, model selection, request volume, and spend patterns.
Operational state. Incidents, changes, dependencies, alerts, and service-level objectives.
Outcome quality. Signals that help teams assess relevance, accuracy, safety, and task completion.
Not every organization will implement all of these capabilities at once. The operating requirement remains the same. Teams need enough connected evidence to move from detection to explanation.
This is particularly important when AI behavior changes without a corresponding infrastructure failure. A model update, prompt change, retrieval change, or new user pattern can alter results while conventional dashboards remain green.
Healthy infrastructure does not guarantee healthy AI.
Tool sprawl creates another operating problem
Many organizations respond to complexity by adding more tools.
One tool monitors infrastructure. Another collects logs. A third handles application errors. A separate platform tracks model usage. Incident records sit somewhere else. Cost data is reviewed in a billing console.
Each tool may perform a valid function. Together, they can create a fragmented operating picture.
Tool sprawl increases the distance between the signal and the decision. Engineers spend time moving between systems, matching timestamps, comparing identifiers, and reconstructing an event after the fact.
That work is expensive during an incident. It is also difficult to standardize.
An observability platform provides a connected control plane for this work. It brings telemetry, service health, incident information, and operating context into a structure that teams can use repeatedly.
The goal is not to replace every existing tool. It is to establish a clear operating layer that connects the tools and signals already in use.
This is why standards matter. Onyx Cloud & AI approaches observability with OpenTelemetry implementation, logs, metrics, distributed tracing, dashboards, alerting, and service-level objectives. The approach is vendor-neutral. The right architecture may extend an existing environment rather than replace it.
Focused but connected.
The practical risks AI observability helps control
AI observability is not only a developer concern. It supports financial control, service reliability, risk management, and operational continuity.
1. Unpredictable behavior
AI systems can produce different results for similar requests. They can also behave differently after a model, prompt, retrieval source, or orchestration change.
Tracing helps teams compare runs and locate the point at which behavior diverged.
2. Cost variation
AI costs are influenced by token usage, model choice, retries, context size, and agent loops.
A small workflow change can produce a meaningful increase in cost without affecting infrastructure utilization. Cost visibility must therefore be connected to requests, users, features, and model activity.
3. Slow investigations
When a request passes through multiple services, a single error message rarely explains the full incident.
Distributed traces help teams follow the request from entry point to final response. They provide a structured account of what happened, where time was spent, and which dependency failed.
4. Governance and accountability
Financial institutions, public bodies, and enterprise operators need records of how systems behave.
An observability platform can support auditability by preserving operational context, access controls, change records, incident history, and system signals in a consistent structure.
The exact governance model depends on the workload and regulatory environment. The requirement for clear evidence does not.
What to look for in an observability platform
A useful platform should support the operating model around the technology, not simply add another dashboard.
Prioritize five capabilities.
Connected telemetry. Logs, metrics, traces, events, and service health should be linked through consistent identifiers and context.
End-to-end investigation. Teams should be able to follow a request across applications, infrastructure, model services, and tools.
AI workload visibility. The platform should support model activity, AI performance, cost signals, and the operational behavior of AI-powered features.
Incident coordination. Alerts should lead into investigation, ownership, response, and follow-up. An alert without an operating process is only noise.
Open integration. The platform should work with existing systems and open standards. It should not make visibility dependent on a single vendor or a complete technology replacement.
The right choice also depends on operating maturity. Some organizations need an assessment first. Others need implementation, managed observability, or help reducing telemetry costs.
Onyx Cloud & AI supports this progression through assessment, delivery, and managed services. Its observability work covers the gap between what an organization collects and what it needs to answer operational questions.
Onyx Insights brings the operating view together
Onyx Insights is Onyx’s observability control plane for system health, telemetry, incidents, and operational context.
It is designed for teams that need a clearer way to understand how services behave across a connected environment. That includes infrastructure signals, application performance, incident activity, and the operating context required to investigate issues.
For AI workloads, this context provides a practical foundation.
AI observability should not sit apart from the rest of the technology estate. Model calls depend on applications. Applications depend on infrastructure. Infrastructure depends on networks, identity, storage, and external services.
These relationships form one operating system, even when the underlying components are managed through different tools.
Onyx Insights is positioned around that connected view. It supports the move from fragmented monitoring toward a more deliberate approach to visibility, investigation, and response.
Built for the work between the alert and the answer.
Traditional monitoring still has a place
The answer is not to discard traditional monitoring.
Infrastructure monitoring remains necessary. Application monitoring remains necessary. Logs, metrics, alerts, and service-level objectives remain core operating capabilities.
The change is in how those capabilities are organized and extended.
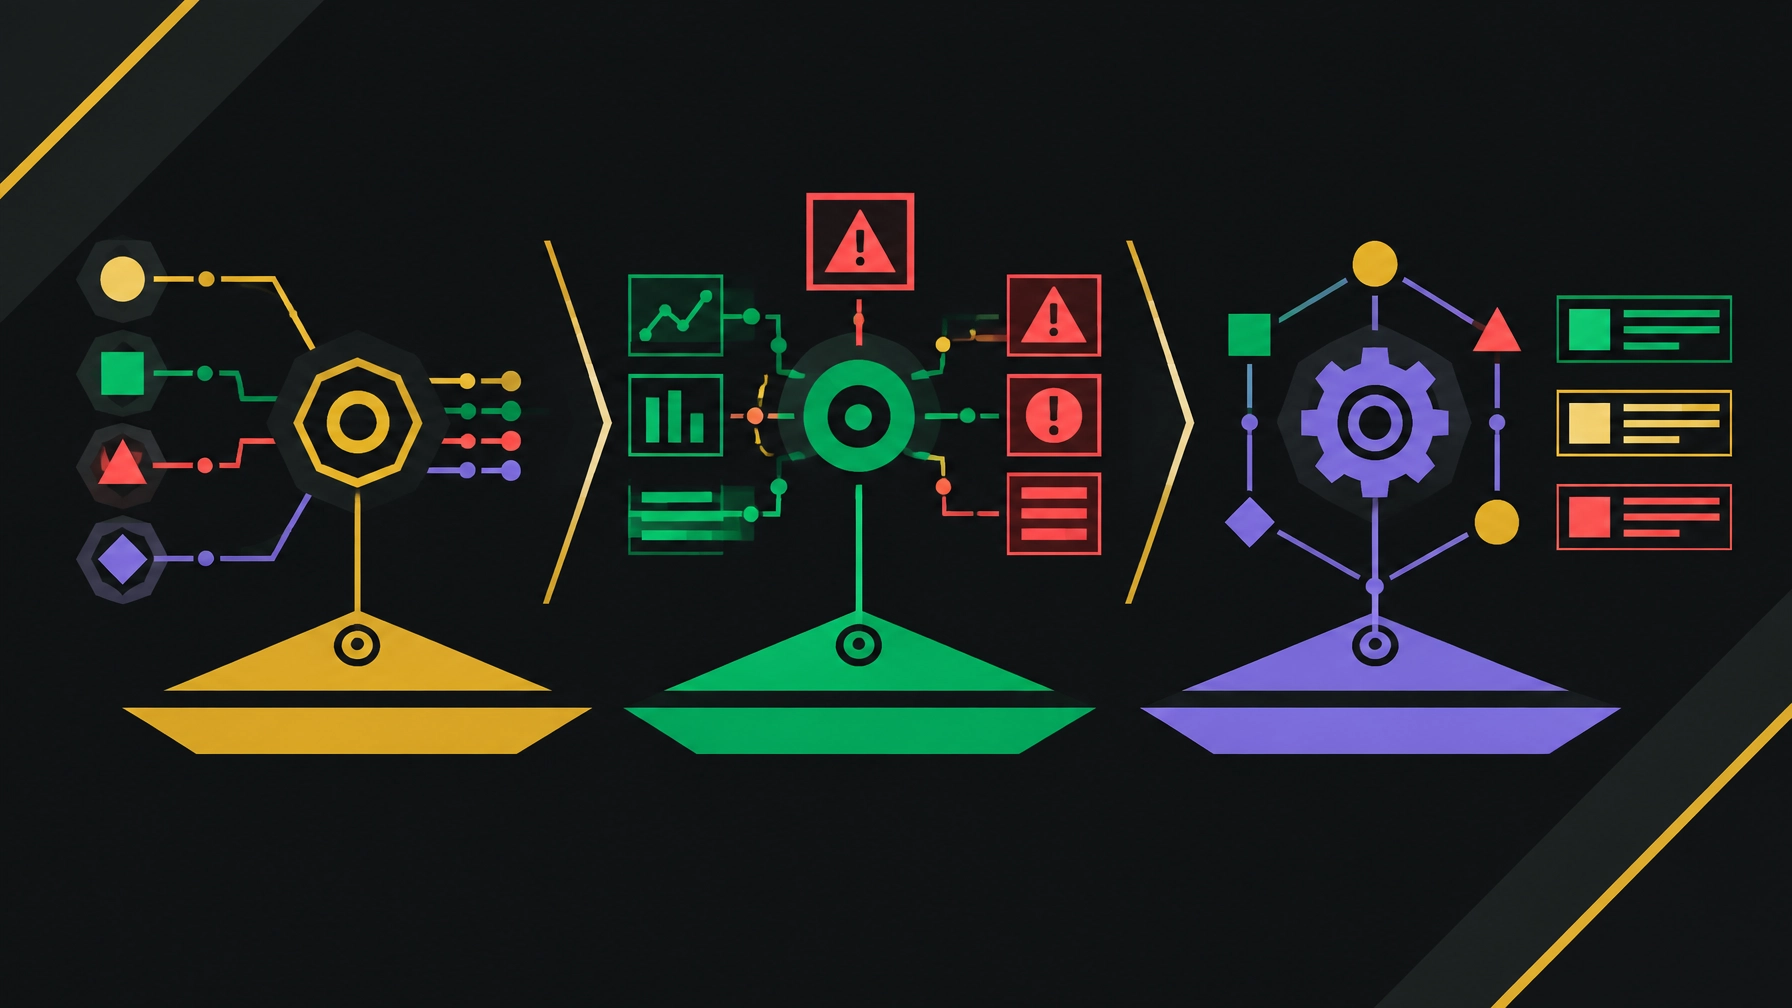
Traditional tools answer known questions about service health. An observability platform connects those answers to the wider operating context. An AI observability tool adds visibility into model behavior, agent workflows, cost, and quality.
Together, these layers create a more complete operating model.
The objective is not more telemetry for its own sake. It is better evidence, faster investigation, measured risk, and more reliable services.
AI workloads are becoming part of real operating environments. They support customer service, analysis, internal workflows, financial processes, and decision support. Their performance must be understood in the same practical terms as every other production system.
The tools are not dead. The isolated view is.
Organizations planning an AI deployment or reviewing an existing monitoring stack can begin with a focused assessment:
- Map the AI workload and its dependencies.
- Identify which signals are already available.
- Document the questions operators cannot currently answer.
- Connect telemetry to incidents, cost, and service outcomes.
- Establish a measured path toward deeper observability.
That work creates a foundation for dependable operation.
Start a conversation with Onyx Cloud & AI about observability, AI operations, or a broader cloud operating model.
Build visibility that supports the work. Operate with context. Grow with discipline.